
Indiscriminate dumping of waste vitiates Turag river
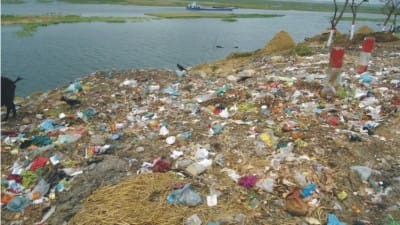
Huge waste is released into the Turag from a disposal outlet at Noaberbag, Mirpur-1.
 For all latest news, follow The Daily Star's Google News channel.
 Due to rapid and unplanned urbanization and industrialization the Dhaka city's surrounding rivers, including the Turag have gradually experienced undue and unbearable pressure to their very existence. Precisely speaking, a handful of complicated problems have almost suffocated these lifelines the city. Of all the problems taking on the rivers, pollution is one that predominates. However, the pollution level and pattern of all the rivers of the city are not the same. The writer has roughly investigated the spatial and temporal pattern along with the extreme pollution points of the Turag River especially from the Buriganga Third Bridge to Tongi Bridge. This write-up intends to elucidate these issues in brief.
Spatial pollution
From the Buriganga Third Bridge to upper stream and from Tongi Bridge to downstream, pollution concentration appears to gradually decrease. The water colour, odour and the DoE provided data prove this unique spatial pollution pattern. The water color becomes pitch-black to almost normal both from the Buriganga Third Bridge and the Tongi Bridge to Goran Chatbari, near Mirpur Botanical Garden.
The main reason behind this spatial pollution pattern in the Turag within above mentioned area is that huge load of untreated toxic liquid chemical waste is directly dumped into the river from Hazaribagh tanneries through the Bashila Khal at the downstream and from the Tongi Industrial Area at Tongi Bridge and Iztema Field area. This very high pollution concentration literally diffuses to other parts of the river through upstream flow during the rainy season and some tidal activity during the dry season. Through lateral diffusion process, the pollution concentration decreases with increase in distance from the pollution source. Pollution concentration comparatively increases in the dry season when water level of the river recedes a lot.
There have been found, according to the field survey, about 28 minor waste disposal outlets to the Turag River. Of them, about 20 are solid (household, commercial, and industrial) waste dumping sites along the embankment which emit huge amount of waste (both bio-degradable and non-bio-degradable) into the river. Along the south-eastern bank of the river, there have been found four sluice gates which dispose huge load of sewerage waste of the DCC area into the river.
The river has also a vast non-point source of pollution. Along its north-western bank, there is a vast agricultural land particularly paddy field from Bagchotra, Savar to Tongi Pourosava area. The residue of the chemical fertilizers used in the cultivable land is also added to the pollution of the river through overland flow resulting from heavy downpour during the rainy season.
Temporal pollution
Department of Environment (DoE) every year collects water sample from the selected points of the Turag River and analyzes the quality of different parameters of water in the departmental laboratory. The selected sample drawing points of the Turag River includes the points near Iztema Field, Tongi Bridge, Gabtali Bridge, and Sinnir Tek BIWTA Landing Station. Analyzing the DoE provided water quality data of 5 years (2006-2010), the following temporal pattern of the Turag River Pollution has been found.
The pH value was 7.1 mg/l in 2006. But at present the pH value of the river water is 7.5 and the related data of the last five years show that the pH has gradually increased over the time. The value of Electric Conductivity (EC) was 98 mg/l in 2006 but in 2010 the value has increased a lot to 1800. The level of chloride was only 2 mg/l but in 2010 it has increased to 34. The level of Turbidity was only 6.5 mg/l in 2006 but in 2010 it has become 12.5. The level of Total Solids (TS) was 380 mg/l in 2007 but has increased to 896 in 2010. Total Dissolved Solids (TDS), was 342 mg/l in 2007 but has become 812 in 2010. But in case of Suspended Solid (SS), the value fluctuated a number of times over the last four years and has increased eventually.
Dissolved Oxygen (DO) level has experienced a little bit fluctuation and has decreased much over the last five years. Most alarming is that the DO level was 6 mg/l in 2006 but now it is 0 mg/l which supports no life in water. It is one of the most important parameter of water quality determination as it is essential for all forms of aquatic life. Biological Oxygen Demand (BOD) level has also increased from 2.8 mg/l to 22 over the last five years. Chemical Oxygen Demand (COD) has also increased considerably from 58 mg/l in 1998 to 102 mg/l in 2010. If we consider the changes that have been brought about to the values of all the parameters of water of the Turag over the last five years, it needs no telling that its quality has been deteriorating day by day alarmingly.
Concluding remarks
It is alarming that the pollution concentration is rapidly increasing day by day as different types of land uses are developing along the banks of the Turag river which lead to more pollution generation and more encroachment on riverbanks. At the same time, it is a matter of fortune that the pollution level of the Turag has not yet gone beyond treatability and the river has not experienced the massive grasp of encroachment like the Buriganga and the Shitalakhya. And now is the great opportunity for launching resuscitation process of the river. So, the government and other stakeholders should seriously consider the resuscitation of the Turag River and take effective actions before it is too late.


Comments